Statistics
Statistics are fun! Most people are interested in the total word count of their story, but we've collected a few other stats as well. You can see your book's statistics from the "Statistics" button in the left side navigation bar:
The statistics are collected into a variety of charts, each discussed below. All charts on this page are specific to the current book.
Our story isn't very long yet so some of these demo charts aren't as interesting as they will be once you really get into your story, but they should serve to show what you can see.
Word Count Breakdown
The Word Count pie chart looks like this:
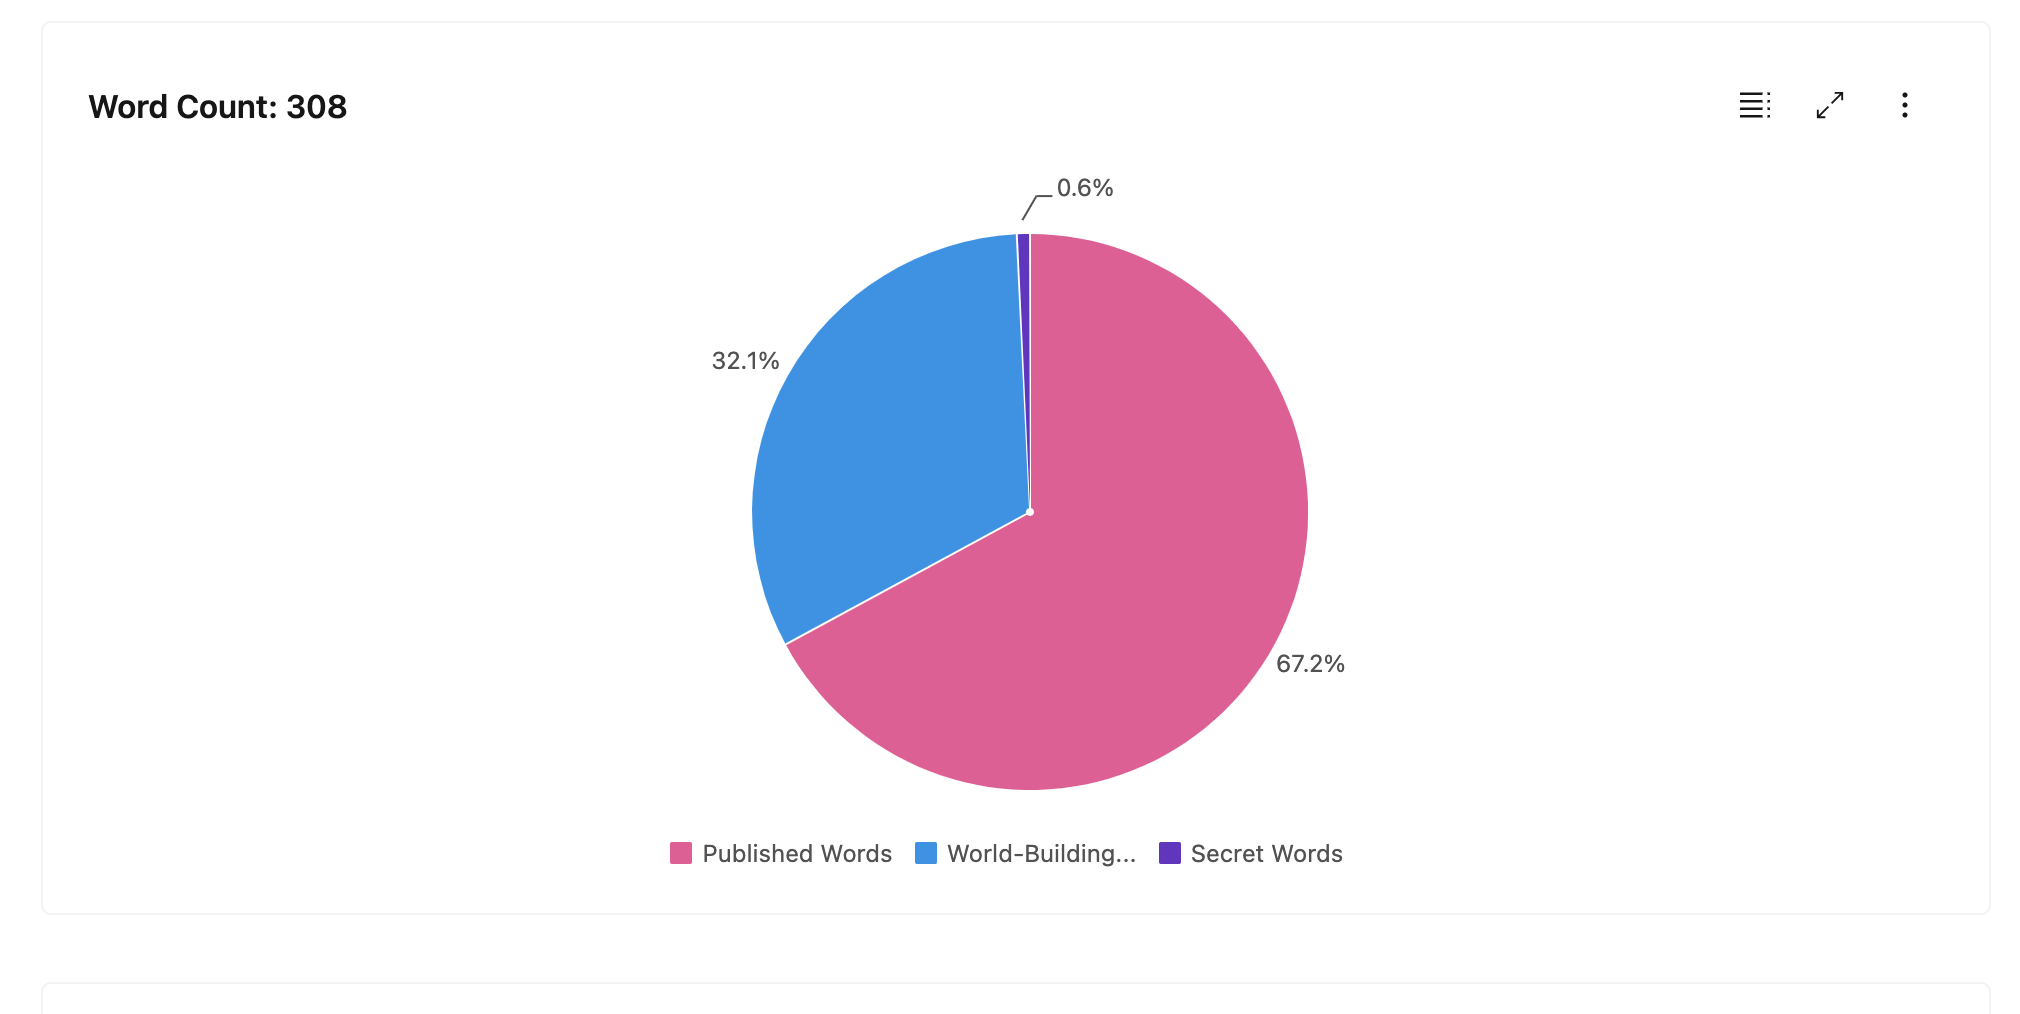
The word count chart describes how many words you've added to this story. The number in the title (308 in this example) is the total number of words you've written in the book, including scene summaries, tag details, secret scenes and manuscript scenes.
The chart below it shows the breakdown by type:
- Published words is the number of words in non-secret scenes that you have written.
- Secret words is the number of words in secret scenes that you have written.
- World Building words is the number of words you've written in scene summaries and tag descriptions. It's not a terribly useful statistic, but it can be kind of interesting to know how big your "iceberg" is to support the words that your readers actually see.
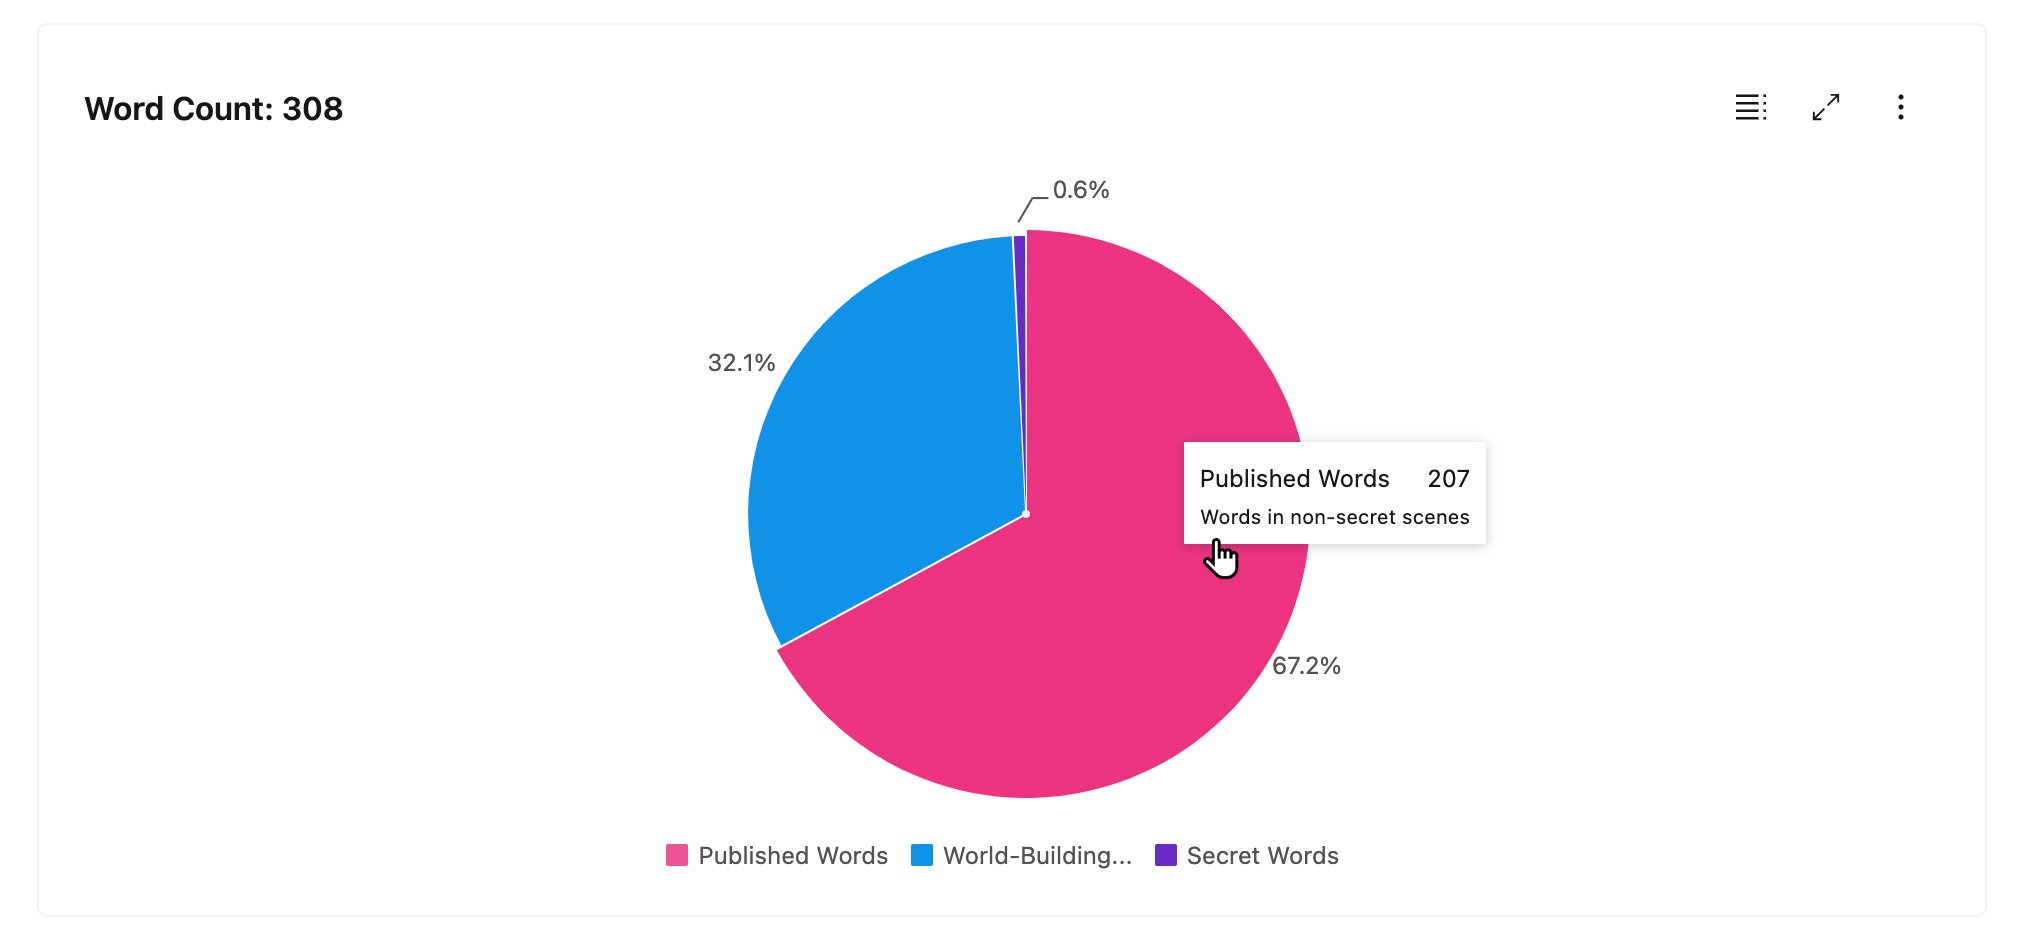
Hover to see specific word counts in each category:
Popular Words
Becky's story so far is particularly fond of the word "nuts."
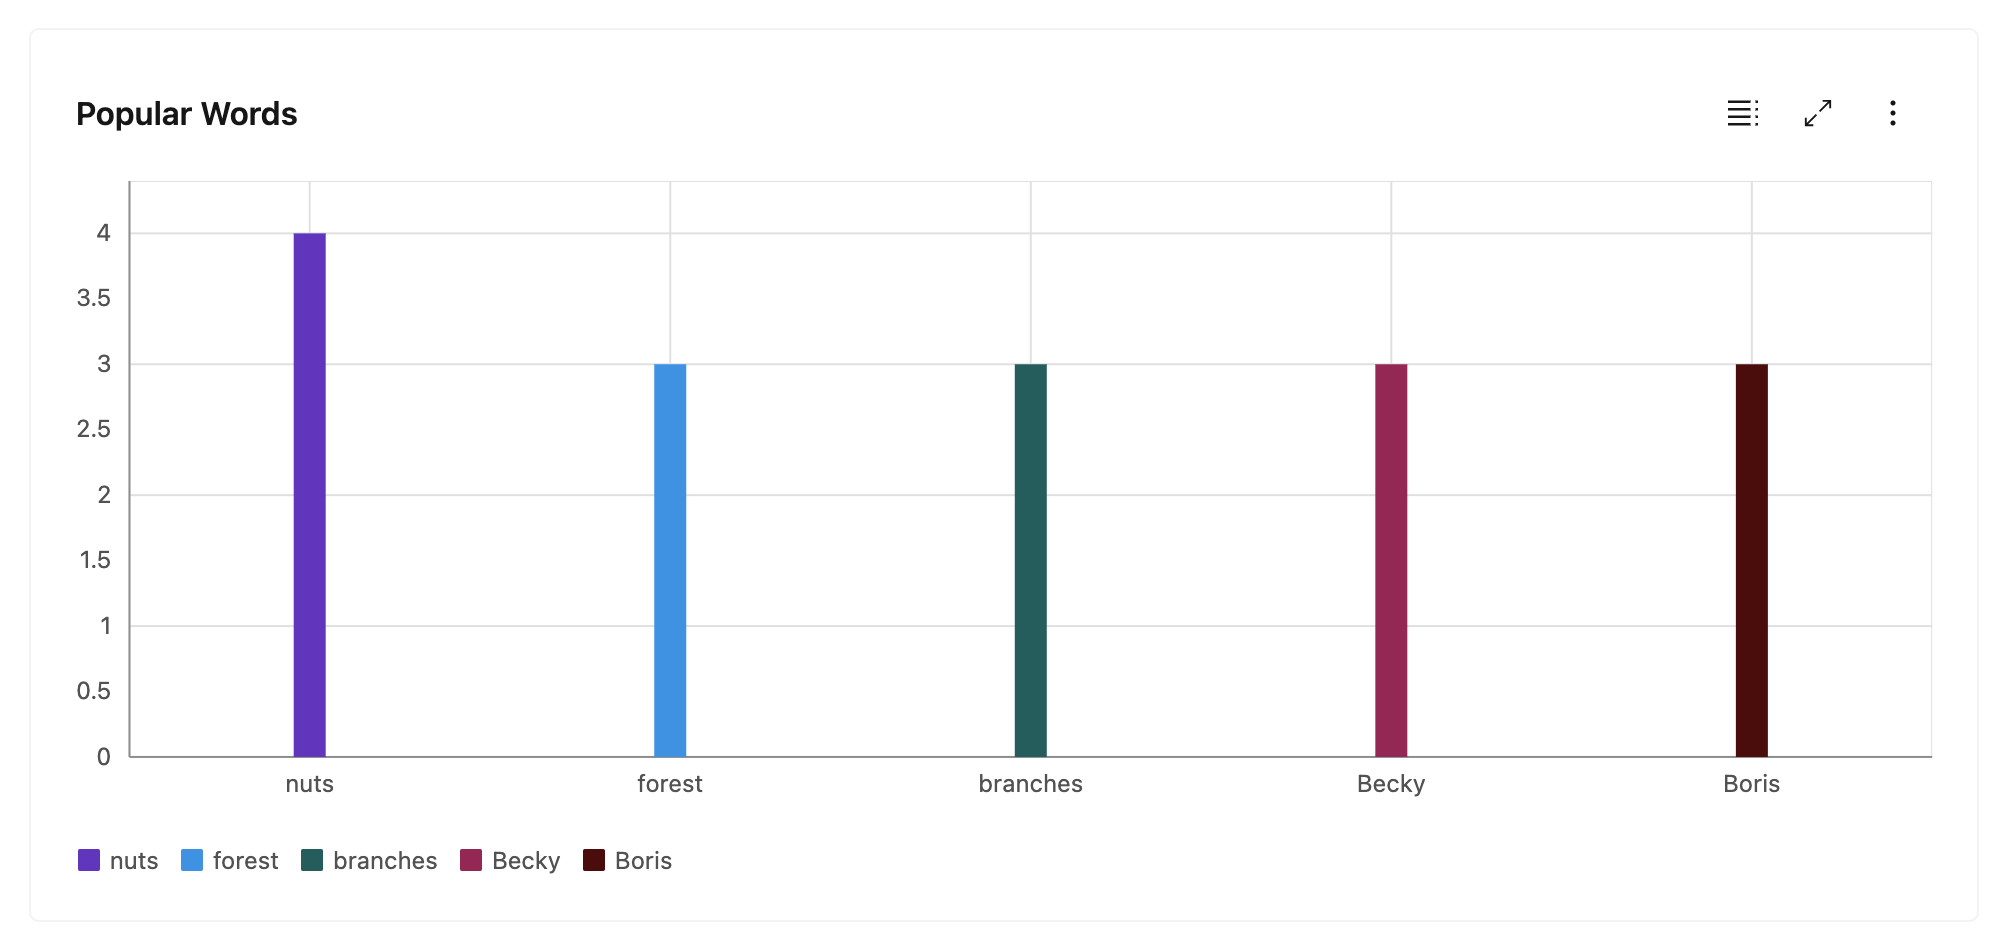
In order to keep the word counter interesting, the Popular Words feature ignores words that have fewer than four letters, or are in the list of the 100 most common words (of four or more letters) in the English language.
Summary data

How many scenes does your book have? Which one is longest? If you have ideas for other interesting data you'd like to see here, let us know!
Top Tags
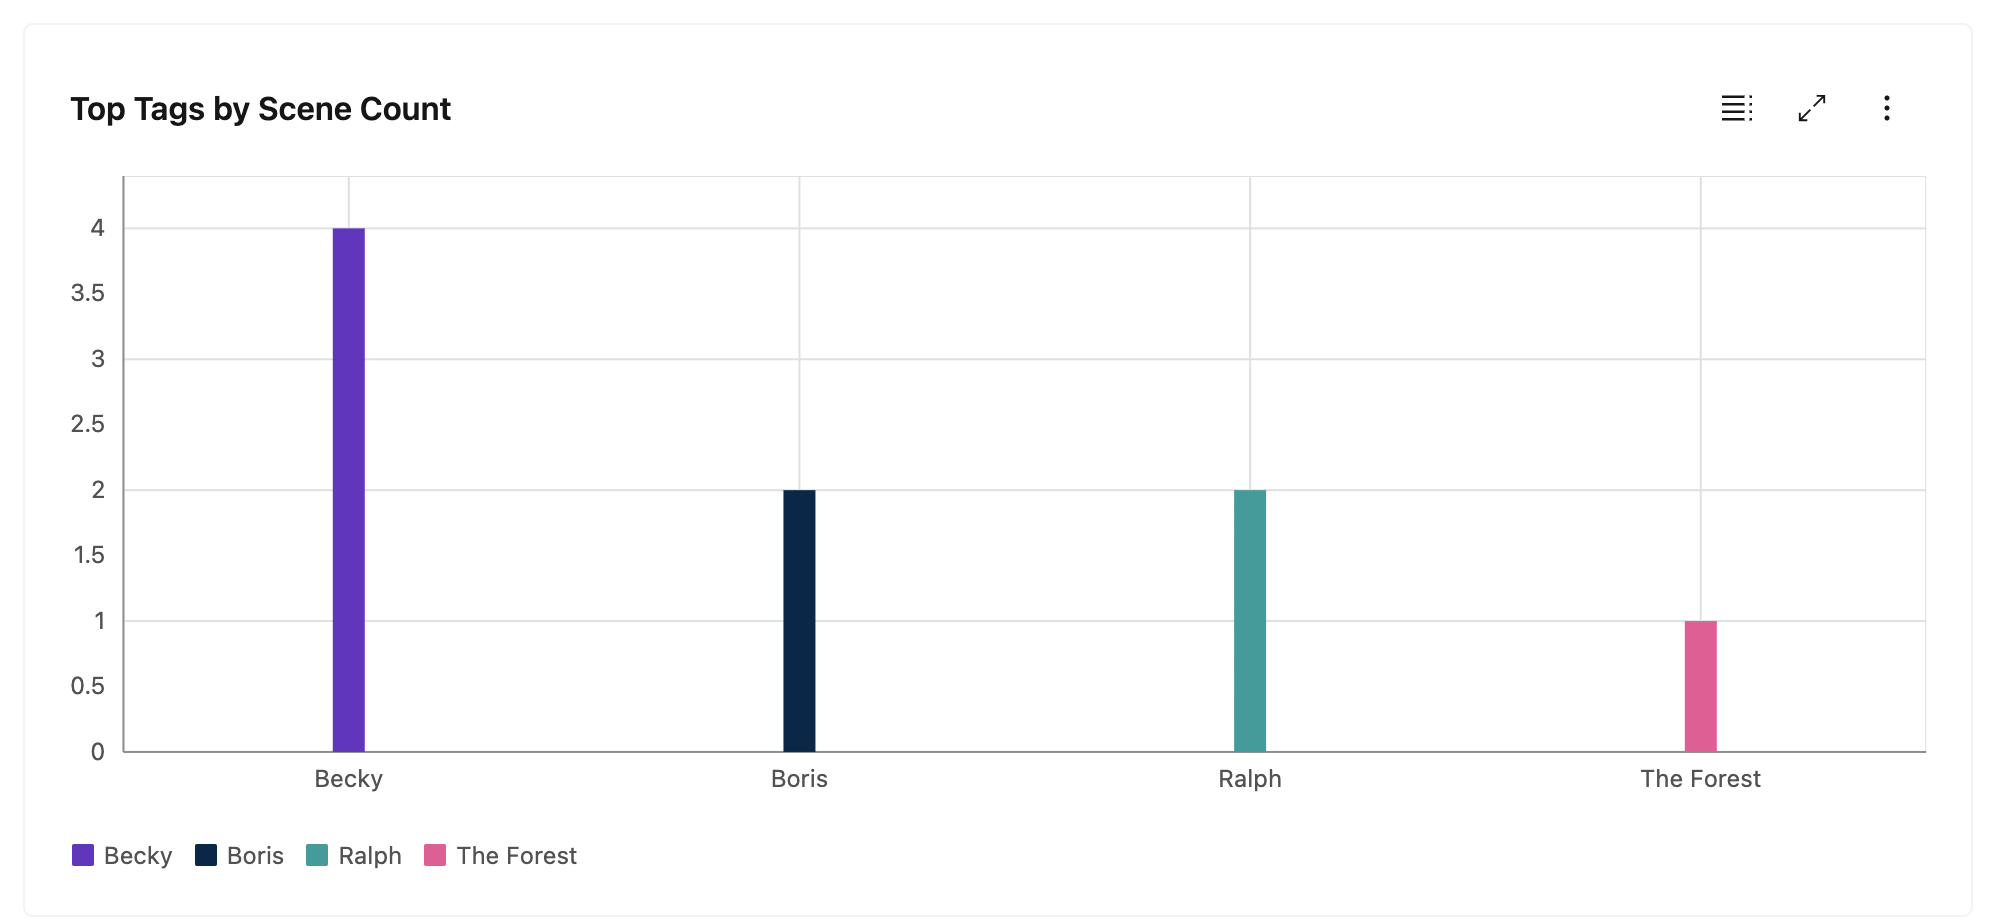
The top tags chart shows the tags you use most commonly based on the number of scenes they are used in. In this case we only have four tags, but you can see that Becky is tagged in two scenes while Boris, Ralph, and The Forest each only have one scene.
There are also five similar charts that show the breakdown of the different tag types (characters, settings, cultures, other, and story goals).
That's all the statistics for now. We want to make statistics more fun and interesting, so please let us know any ideas you have for data you'd like to collect.